Tree
After selecting your URIs, you can navigate through the hierarchy to find your data and plot it on a chart.
In each URI, at the first level, you will find the IDS of each occurrence. For each IDS, you will find the corresponding tree.
In this tree, there are different types of data (Structure, Table, Float, Integer, Text), and each type will have its corresponding icon, except for Structures and Tables, which will share the same icon.
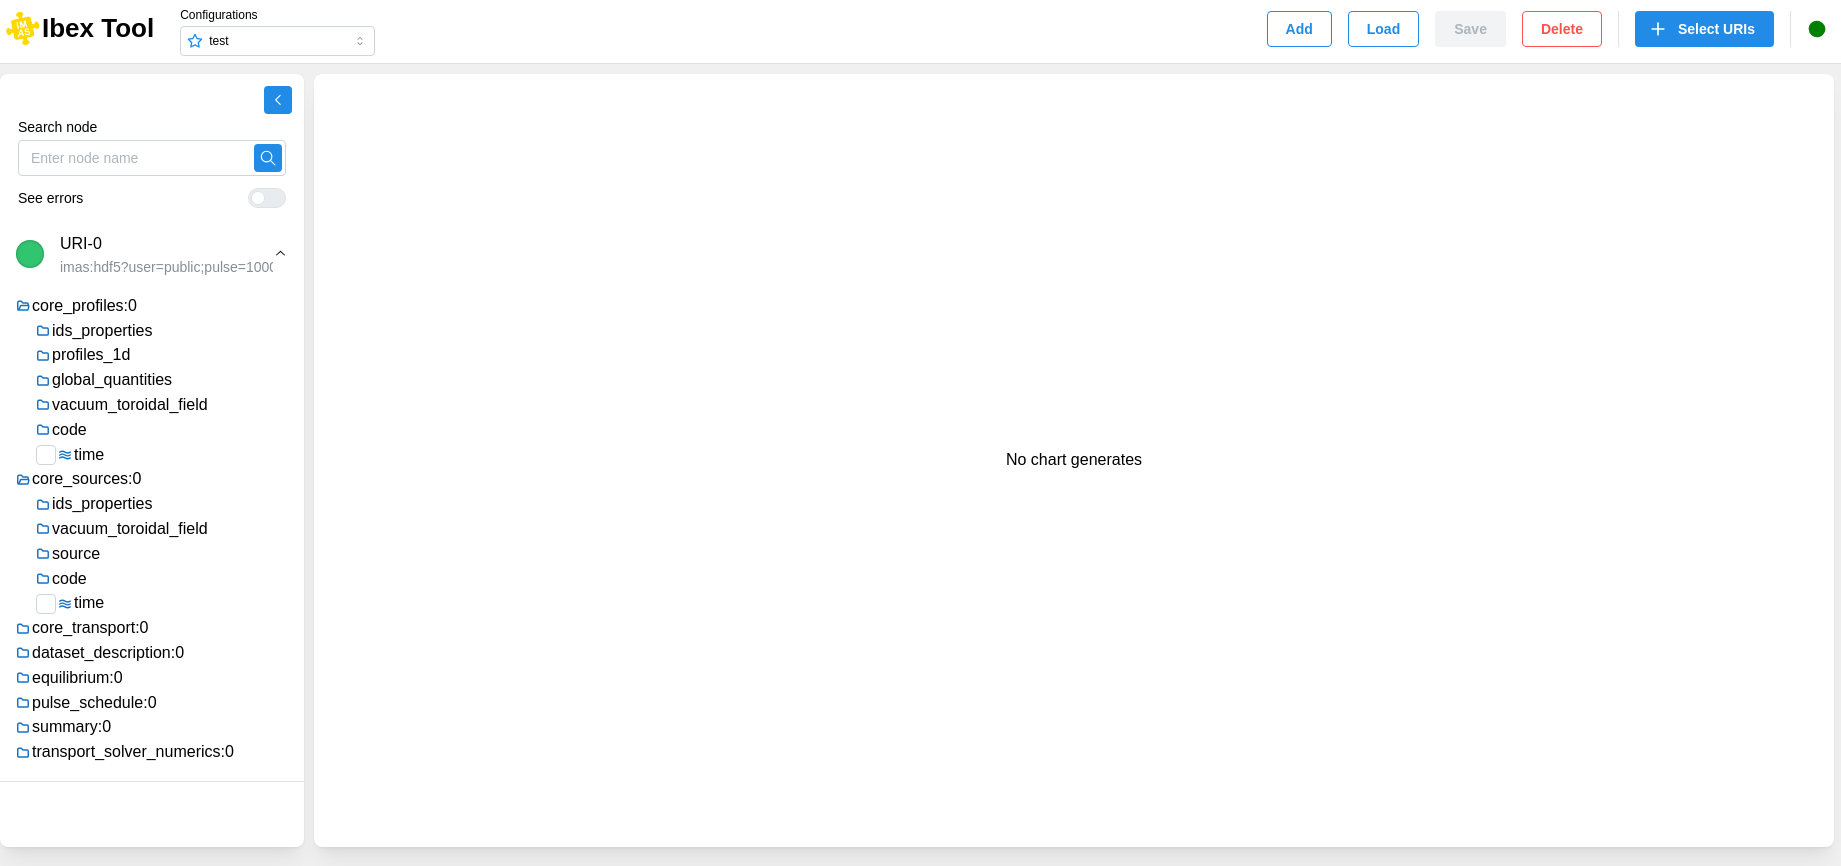
You can collapse the tree view to allow other components to use the full available space.